
Articles / Reporting
What good multi‑market marketing reporting actually looks like
And how to build reports that lead to decisions

On this page
Talk through your reporting
We will look at how your markets report today and where the numbers stop matching.
Clear, actionable marketing reports
Many international teams use multiple decks, platform exports and spreadsheets to track performance. However, endless charts rarely help teams make better decisions. Delayed numbers and conflicting data fail to answer key business questions, and adding more data does not fix the problem.
Why scaling creates reporting issues
Adding new channels, markets and partners creates a lot more work and more data discrepancies. Here are some common problems:
- Inconsistent definitions. Different teams often define key terms (conversions, revenue, new customers and so on) differently. This breaks cross-channel reporting and leads to wrong conclusions from mismatched data.
- Manual spreadsheets. Copying data manually wastes days every month. It introduces hidden errors and prevents quick follow-up analysis.
- Delayed insights. Receiving reports weeks late means wasted spend runs unchecked.
- Siloed data. Separate tools count results differently. Choose one authoritative source per metric instead of trying to force all tools to match.
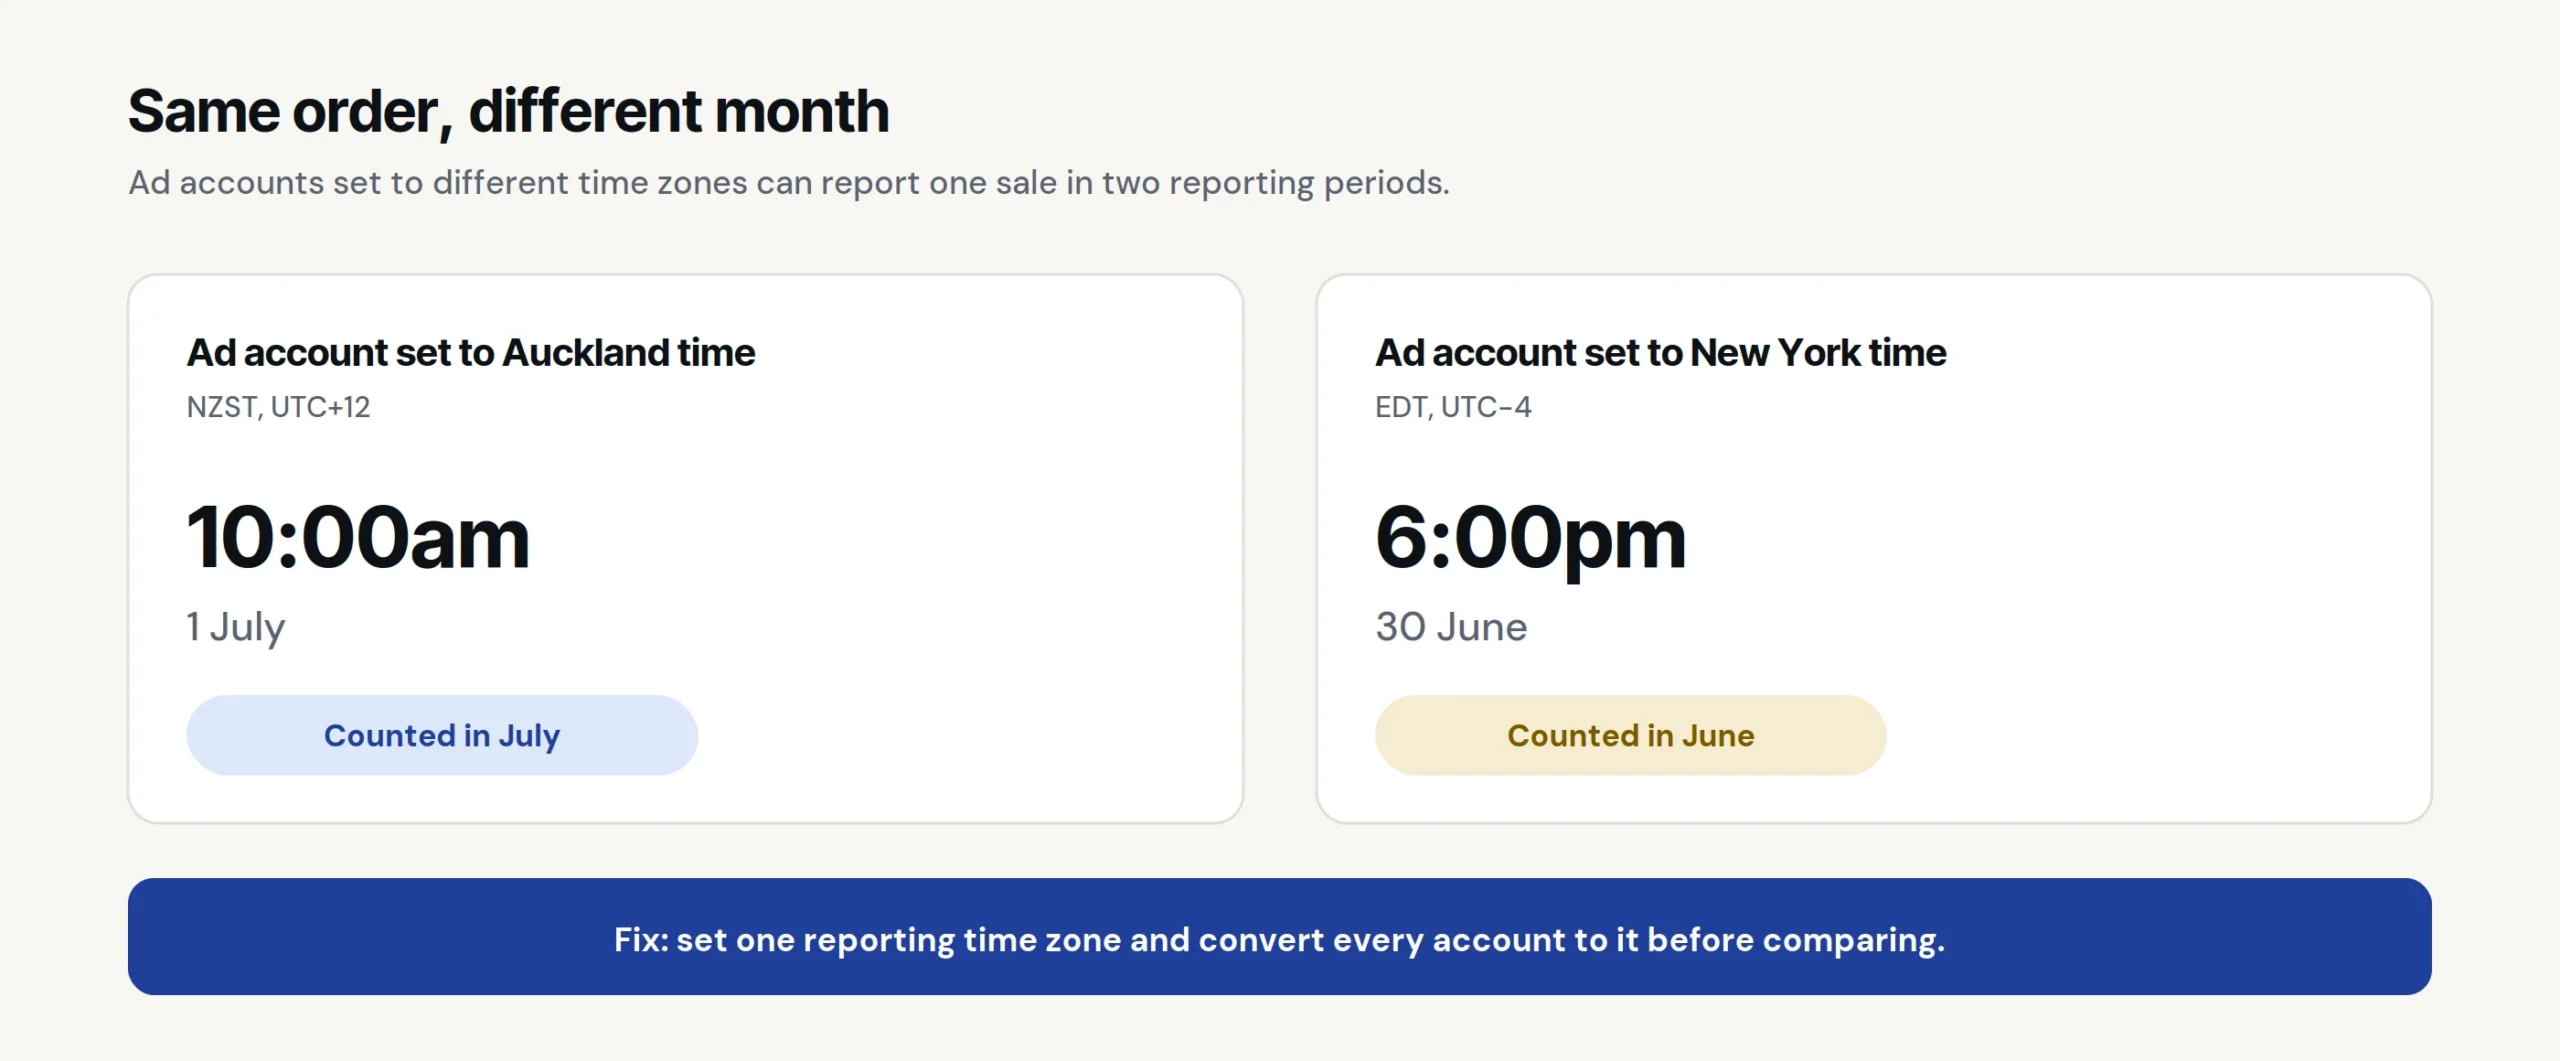
- Currency and time zone differences. In multi-market marketing reporting, fluctuating exchange rates and mismatched account time zones distort totals, trends and month-end comparisons.
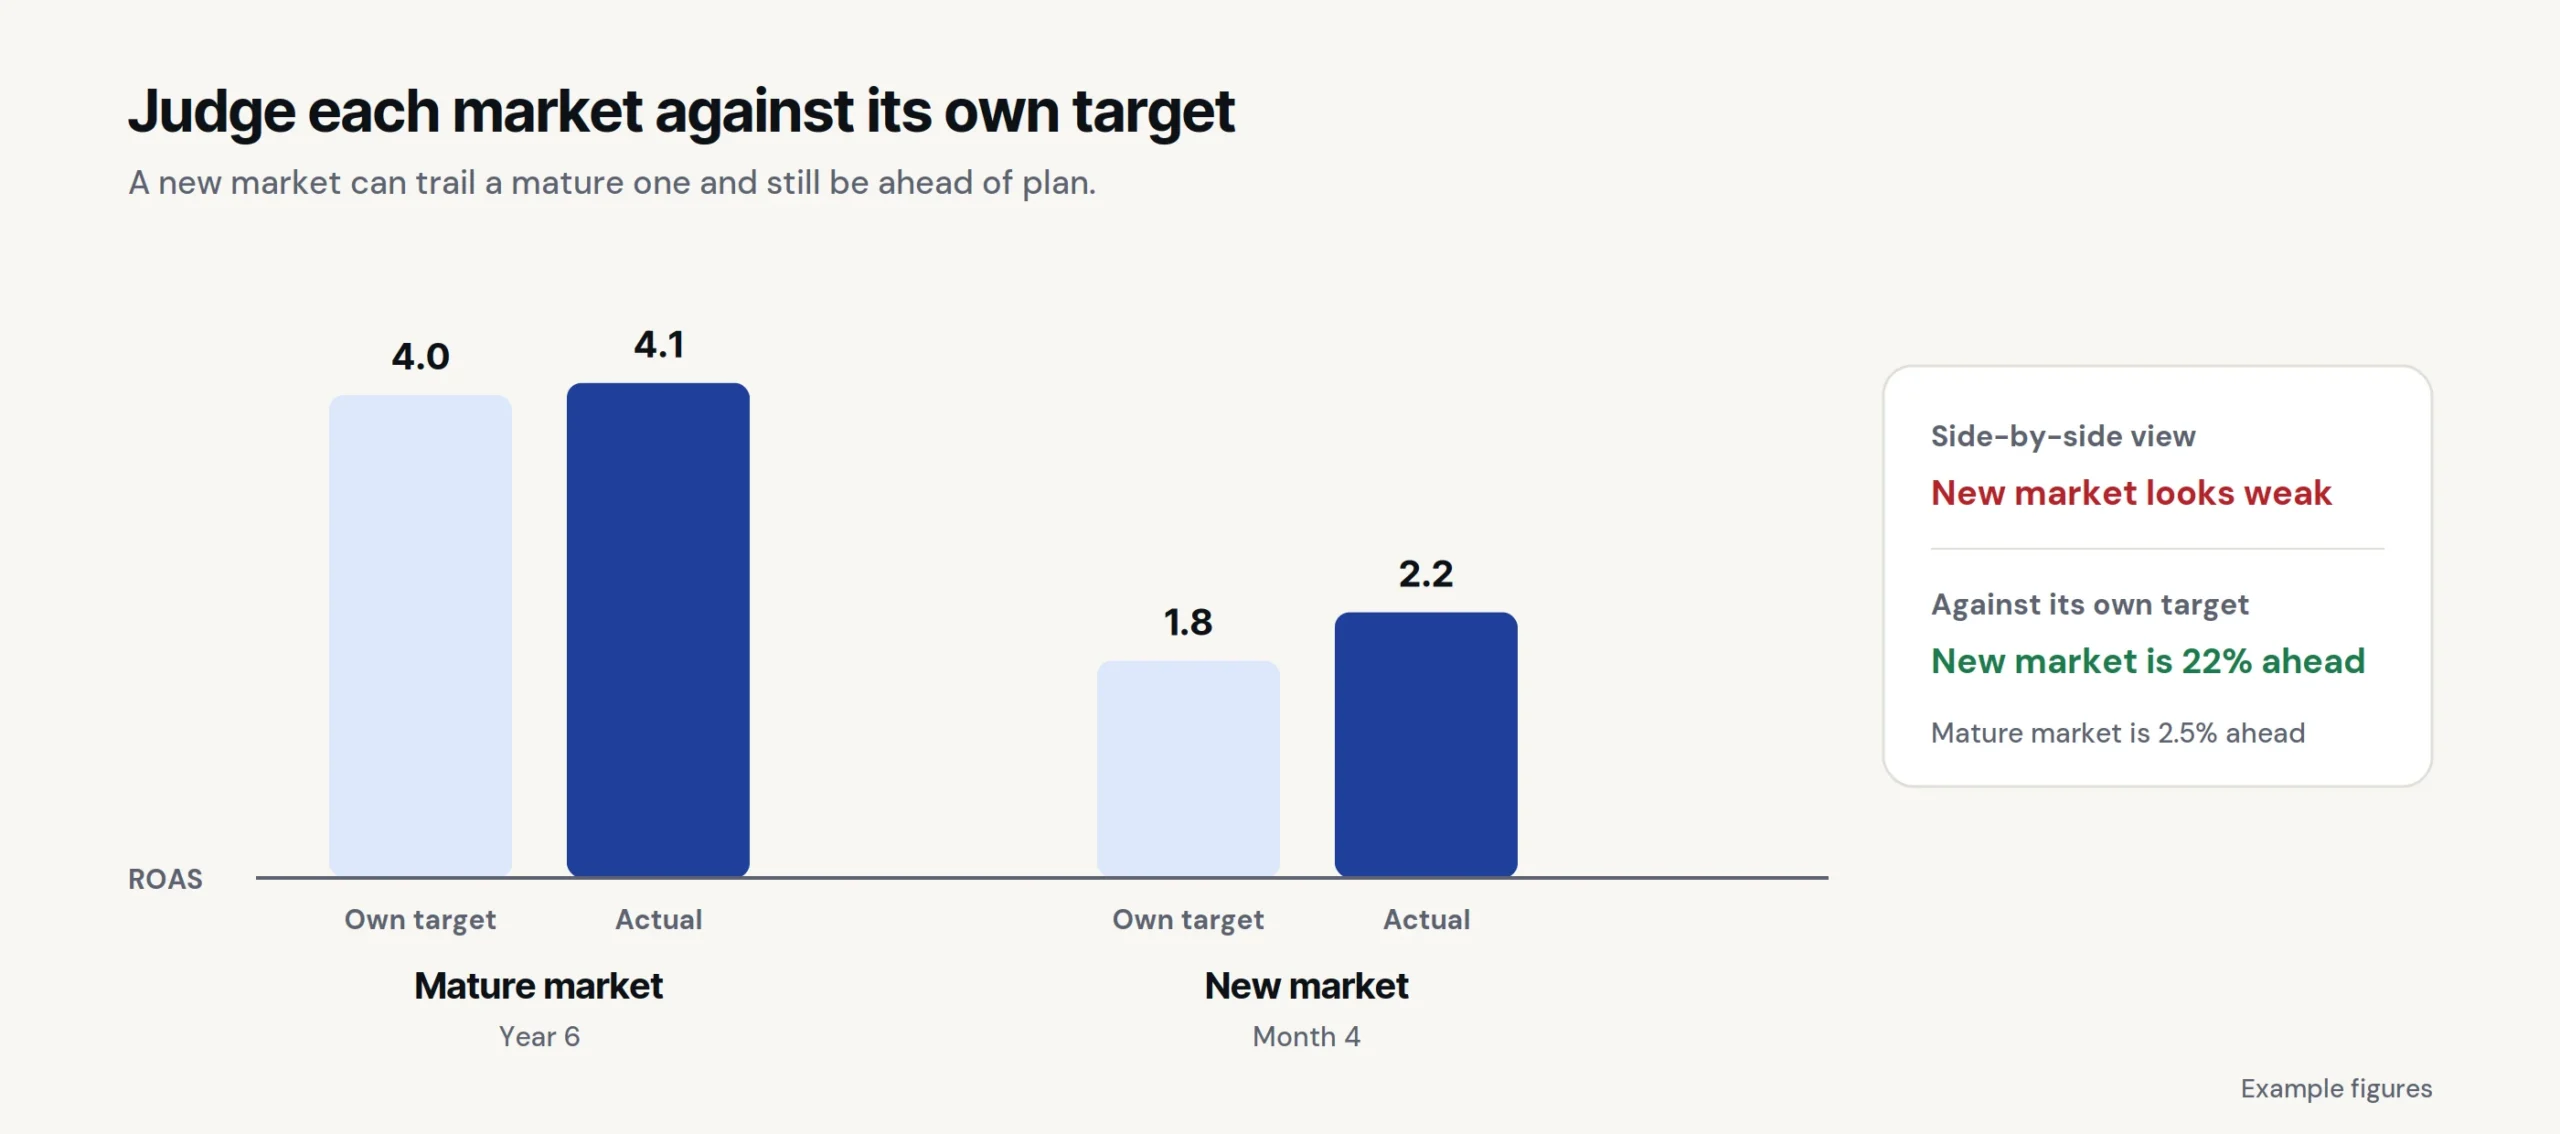
- Unfair market comparisons. Comparing new markets directly to mature ones ignores brand history and conversion data, leading to flawed evaluations.
Focusing on decisions
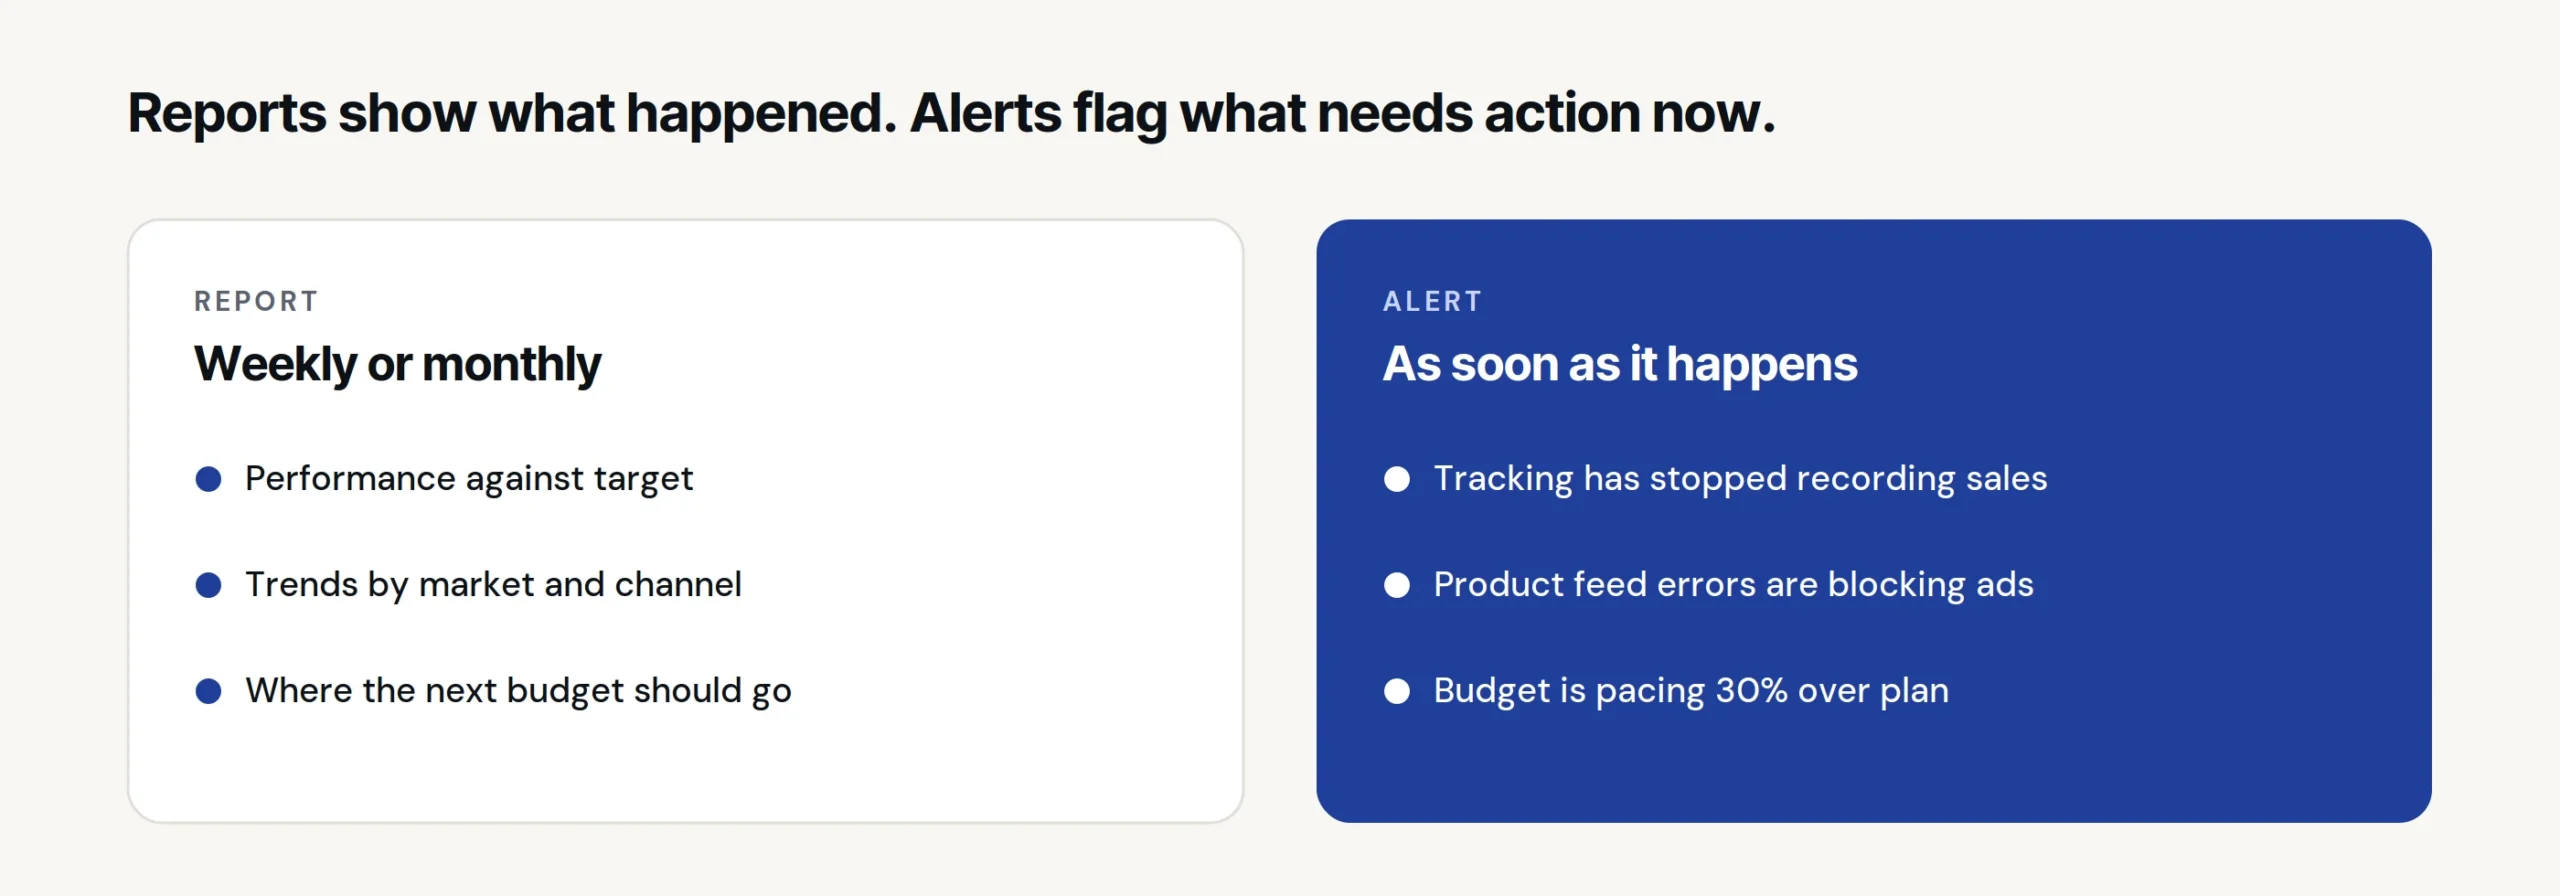
Every metric in your report should inform a specific choice, such as reallocating budget or fixing product data. Clear performance reporting tells you what happened, while automated monitoring alerts you when action is needed.
Six pillars of decision-focused reporting
- Standardised definitions. Document rules for attribution, conversions and currencies across all teams and partners, so you spend less time arguing about whose numbers are right.
- Automated data collection. Automating data collection saves time and keeps updates reliable. Marketing reporting automation means you can answer questions quickly. An automatically updated marketing reporting dashboard also keeps reports running when someone is on annual or sick leave, and reduces human error.
- Automated exception alerts. Set up alerts for tracking failures, product feed errors and budget pacing issues so teams can act quickly.
- Role-based views. Tailor your marketing dashboards to different audiences. Executives need high-level performance metrics that are easy to understand, while channel specialists need granular technical data.
| Audience and cadence | Core question | What metrics you need |
|---|---|---|
| Executive or board, quarterly | Are we investing well overall, and is anything at risk? | Blended acquisition cost and revenue against plan, in one normalised currency, with market contribution and short written commentary. |
| Head of marketing, monthly | Where should the next budget increment go? | Channel and market efficiency against targets, trend over 12 weeks, and a pipeline of tests with their status. |
| Country or regional manager, weekly | Is my market on track, and what is holding it back? | Local currency detail, market-specific targets adjusted for maturity, and local competitive and seasonal context. |
| Channel manager, daily | What do I change this week? | Campaign and asset group detail, feed health, tracking status and exception flags. |
- Maturity-adjusted comparison. Evaluate markets against their own targets and growth timelines rather than directly against established markets. Account for regional differences through proper localisation and market adaptation rather than assuming identical performance everywhere.
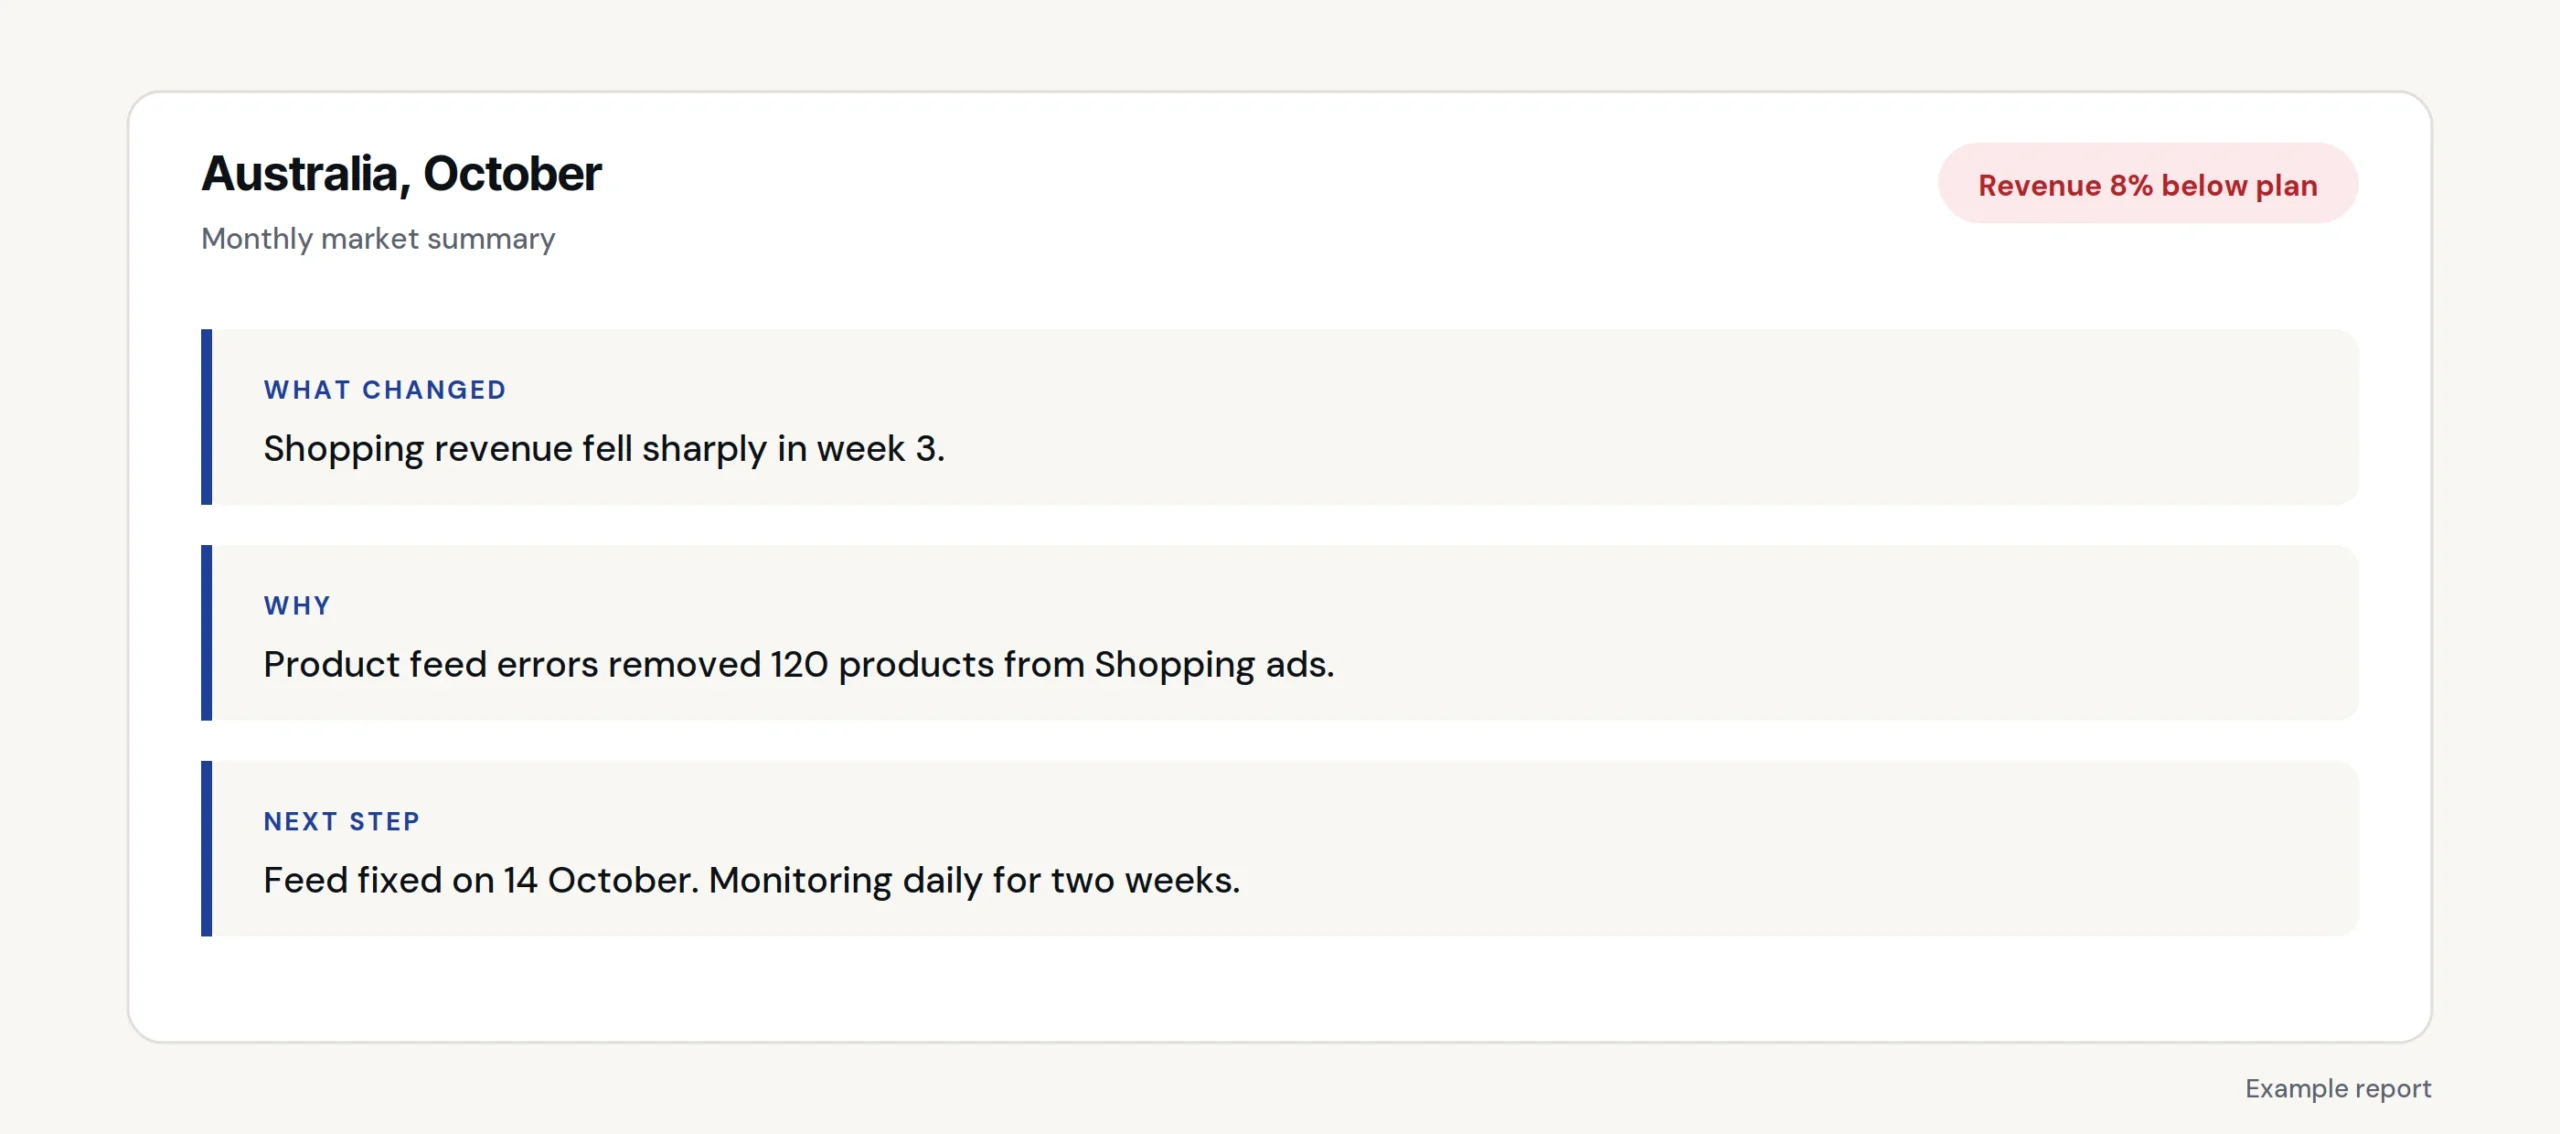
- Actionable analysis. Include brief written summaries explaining key changes, causes and recommended next steps alongside raw data.
Transforming your reporting
We build reporting and marketing operations systems for businesses running paid media across multiple markets, usually where several agencies or internal teams are involved and the numbers no longer reconcile. If you would like to upgrade your marketing reporting and automation, get in touch.
Reporting across several markets?
Tell us which markets, channels and partners you report on, and we will explain how we would set up reporting for your team. A senior team member will reply within one business day.